Dear native brook! wild streamlet of the West!

An independent local flood-awareness and catchment-observation project for the Colaton Raleigh Stream, combining a local water-level sensor with Environment Agency, groundwater, rainfall and weather data.

Two different jobs, used together.
Catchment scoring is intended to give advance situational awareness. The local Streamlet sensor provides immediate physical action triggers.
Overall Streamlet status
Loading…
Reading current data…
Official EA context: loading…
Streamlet is loading the latest local and catchment conditions.
What is happening here now?

Local Streamlet sensor

—
Water level—
30-min rate of rise—
Reading age—

Local physical trigger for the monitored reach. Exact sensor location is intentionally not published.

What may be developing?

Catchment awareness

—
EA gauge at Pophams Farm—
30-min rate of rise—
Catchment score—

Uses the EA gauge at Pophams Farm as the primary stage input, with wetness and groundwater context. It is an awareness layer, not the local physical threshold ladder.

Local level and action thresholds

The local Streamlet sensor is the immediate physical trigger. Its recent record is now shown on its own scale rather than overlaid with the EA gauge at Pophams Farm; the two sites have different hydraulic settings and absolute stage values are not directly comparable.

Milesight vented logger

Local stage — recent 24 hours

—
Local water level only. The adjacent threshold ladder provides the action context rather than forcing the Pophams record onto the same graph.

Local threshold ladder

< 0.800 mNORMAL
0.800 mWATCH
0.900 mFOOTBRIDGE ACTION
0.977 mWARNING — channel-full / local concern
1.200 mTAKE ACTION
1.384 mPhysical overtopping reference

How Streamlet works

Streamlet is both a live local monitoring system and a growing hydroinformatics dataset. It combines field telemetry, catchment context and transparent decision logic on a Raspberry Pi, while steadily building the historical event archive needed for future machine-learning work.

Field system

From water level to Raspberry Pi

A Milesight vented level logger provides the local stage signal. It transmits by LoRaWAN via a SenseCAP gateway and TTN. A local Raspberry Pi receives, stores and interprets the data, using SQLite as the core on-site data store.

Local stage telemetryLoRaWAN / TTNSQLite archivePi dashboard + website
External context

Catchment and atmosphere

Streamlet also ingests Environment Agency level and rainfall data, groundwater context, COSMOS-UK soil moisture, and weather-derived variables such as rainfall, VPD and ET₀. These additional data help distinguish immediate local impacts from broader catchment priming and storm response.

  • EA gauge at Pophams Farm for catchment-stage context
  • Antecedent wetness and wet-day counts
  • Groundwater seasonal percentile / priming signal
  • Regional soil-moisture and atmospheric-drying context
Diagram showing how Streamlet works from local sensor and external data through the Raspberry Pi to dashboard, alerts and website outputs
System architecture. Local telemetry from the monitored reach is fused with wider hydrometeorological context on the Pi. Streamlet then publishes dashboard, website and alert outputs while retaining a growing historical dataset for later analysis.
1. ObserveLocal stage is measured by the vented logger at the monitored reach.
2. TransmitReadings pass through the SenseCAP gateway / TTN pipeline to the Raspberry Pi.
3. InterpretPi services combine local data with EA, groundwater, rainfall, COSMOS and weather context.
4. CommunicateStreamlet updates the dashboard and website, records event history and can send email / WhatsApp alerts.
Technical backbone
Local loggerMilesight vented water-level logger measuring the monitored reach.
TelemetryLoRaWAN via SenseCAP gateway and TTN uplinks.
On-site computeRaspberry Pi services handling acquisition, enhancement, plotting and alert logic.
StorageSQLite for raw telemetry plus derived status / event history.
OutputsFullscreen local display, Cloudflare-hosted public website, email alerts and WhatsApp TAKE ACTION messaging.

Catchment wetness and situational awareness

This is deliberately retained in full. The point is not just to tell you where the stream is now, but whether the catchment looks increasingly capable of responding rapidly.

Antecedent flow
—

Wet-flow days in the last 30 days. The scoring modifier activates at 18 days.

Rainfall wetness
—

Days with at least 5 mm rainfall in the last 30 days.

Groundwater priming
—

Seasonal groundwater context used to increase catchment sensitivity when storage is high.

Forecast rainfall
Next 24 h total—
Next 48 h total—
Max 1-hour rainfall—

24 h and 48 h are cumulative totals from now. The 48-hour figure includes the first 24 hours; it is not a separate “day 2” total.

Current interpretation

—

—
Environment Agency gauge at Pophams Farm

Catchment stage — recent 48 hours

—
This is the catchment-awareness stage record, shown separately from the local Milesight sensor. Shape and rate of change are useful; absolute stage should not be compared directly with the local logger.

Rainfall — observed and forecast

Observed rainfall comes from the Environment Agency Colaton Raleigh gauge and is aggregated from qualified 15-minute totals. Daily totals show when the rain arrived; the cumulative curve shows how much has built up across the last 30 days.

Observed

Last 7 days

—
Observed

Last 14 days

—
Observed

Last 30 days

—
Antecedent dryness

Current dry spell

—

Consecutive days with less than 0.2 mm/day.

Daily rainfall — last 30 days

Daily totals from EA 15-minute rainfall observations at Colaton Raleigh.

Cumulative rainfall — last 30 days

The running total across the same 30-day period. A steepening line marks wetter spells; a flat section marks little or no rain.
Forecast totals from now

What is expected next?

Next 24 h total—
Next 48 h total—
Maximum 1-hour rainfall—

Both totals begin now. The 48-hour value includes rainfall in the first 24 hours; it is not the rainfall for a second separate 24-hour period.

Live radar

See where the rain actually is

For a live spatial view of approaching rainfall, open the Netweather UK rainfall radar.

External service. Radar presentation and update frequency are controlled by Netweather.

Where does today’s flow sit historically?

The flow-duration curve is deliberately large again. It uses the long record of qualified daily-mean flow at the Environment Agency gauge at Pophams Farm. Q-values are exceedance frequencies: for example, Q95 is a flow equalled or exceeded on about 95% of days.

Latest qualified daily mean
—
Loading historical position…
Q0–10
Highest-flow end
Q10–25
High-flow range
Q25–50
Above median
Q50–75
Below median
Q75–95
Low-flow range
Q95–100
Lowest-flow end
These range descriptions are plain-language qualifiers for orientation, not formal Environment Agency hydrological classifications.
Loading flow-duration data…

Groundwater context

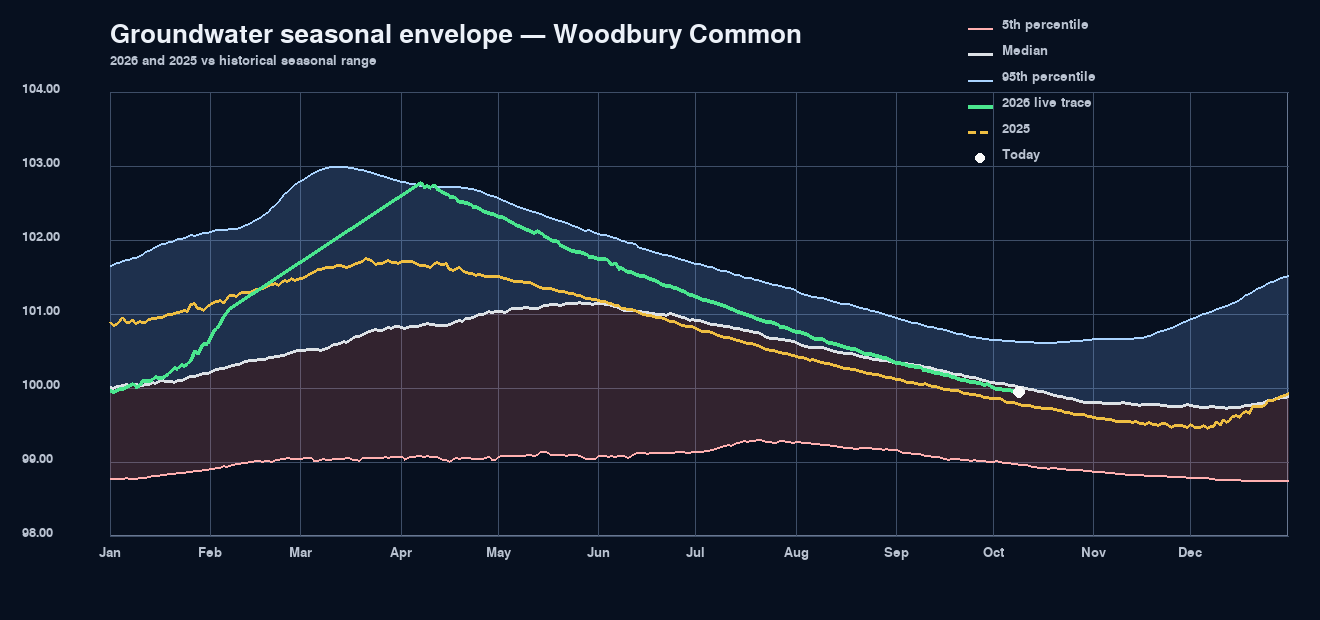
Groundwater is part of the catchment memory, not a decorative extra. The current Woodbury Common level is shown alongside its seasonal percentile, recent trend and longer-term envelope.

Current groundwater condition
Groundwater level
—
mAOD
Seasonal percentile
—
relative to historical levels for this time of year
Approx. 24-hour change
—
m/day

Loading groundwater context…

Seasonal groundwater envelope
Current-year groundwater level against the historical seasonal envelope.
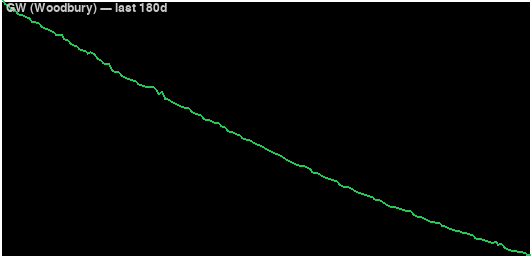
Recent groundwater level
Woodbury groundwater — recent 180-day context.

Regional soil-moisture context

COSMOS-UK helps show how regional soils are drying or rewetting. The two comparator sites are shown separately because their absolute VWC values are controlled by different soils and should not be compared as though they share one scale.

North Wyke

Loading COSMOS-UK soil-moisture history…

Sydling

Loading COSMOS-UK soil-moisture history…
How to read this. Each plot uses its own vertical scale and shows the most recent ~30 days of volumetric water content (VWC). These are regional comparator stations, not measurements in the Colaton Raleigh catchment. Streamlet uses station-relative context when screening for unusually dry / potentially water-repellent surface conditions.

Atmospheric drying, soil response and summer runoff

This is one of Streamlet’s more experimental pieces of catchment science. VPD and ET₀ describe atmospheric demand; Streamlet combines their seasonally referenced behaviour into Atmospheric Drying Pressure, then asks whether persistent drying, soil-moisture context and lack of rainfall reset could be changing the way the catchment responds to the next storm.

Dry-air demand

VPD

—

Vapour pressure deficit is calculated from air temperature and relative humidity. Higher VPD means a stronger atmospheric gradient drawing water from vegetation and exposed surfaces.

Integrated demand

ET₀ today

—

Reference evapotranspiration integrates radiation, temperature, wind and humidity, so it captures more of the total drying environment than VPD alone.

Seasonal combination

Atmospheric Drying Pressure

—

—

Near-term demand

ET₀ next 24 h

—

Useful for seeing whether the drying environment is expected to persist before the next rainfall.

A little household science

Is today a good day for drying washing?

Calculating…—

Checking the remaining daylight hours against forecast drying conditions.

Best window: — Wind: — VPD: — Solar: —
Hourly outlook · next two daylight periods
Comparing the next two daylight periods…

Experimental washing-line outlook. It scores daylight hours using forecast VPD, ET₀, wind and solar radiation; forecast rain vetoes a wet hour. Night-time hours are deliberately omitted. The hourly bars help show whether conditions are improving or whether waiting for the following day may be worthwhile. It is a practical household indicator, not meteorological advice.

VPD — recent and forecast atmospheric demand

VPD is an hourly dry-air stress indicator. The vertical marker separates recent/modelled hours from forecast conditions.

Atmospheric Drying Pressure — seasonal context

Prototype daily index referenced to the seasonal baseline.
Streamlet prototype ADP: 0.7 × ET₀ seasonal percentile + 0.3 × daily maximum VPD seasonal percentile.
1. Atmosphere driesElevated VPD and ET₀ increase evaporative demand.
2. Drying persistsRepeated above-normal ADP with little rainfall builds a surface-drying memory.
3. Soil condition mattersCOSMOS station-relative VWC, dry-spell length and recent rainfall reset are used to screen for unusually dry / potentially water-repellent conditions.
4. Next storm may respond differentlyOn susceptible surfaces, intense rainfall can initially bead, run off or bypass a dry matrix rather than infiltrate uniformly.
Why this might matter for summer flood response. Prolonged drying can promote water repellency in some soils and organic surface layers. During the first intense rainfall after a dry spell, initial matrix infiltration may therefore be reduced and runoff can become more rapid or spatially concentrated. But this is not a universal relationship: dry soils may also have substantial storage, and shrinkage cracks or macropores can increase preferential infiltration. Streamlet therefore treats “waxiness” as an experimental screening signal rather than a runoff prediction.

Experimental context indices

Experimental These indicators help describe catchment state and build a useful event record. They do not directly replace the flood-trigger logic.

Dryness

—

—

Surface drying build-up

—

—

Soil waxiness risk

—

—

Water-repellent surface potential

—

—

More regional and storm context

Additional observations that are useful for interpretation but are not direct local measurements.

Regional soil context

COSMOS soil moisture—
COSMOS comparator—

Regional COSMOS measurements are contextual comparators, not local soil measurements.

Storm context

Lightning (24 h)—

Lightning is a supporting weather-context indicator only.

How Streamlet decides when to shout

The live warning system is deliberately transparent. Streamlet currently uses a hybrid rule-based approach: catchment scoring provides advance awareness, while the local sensor provides immediate physical confirmation. This is separate from the future WALTER-R machine-learning layer.

Advance awareness

Catchment score

EA stage at Pophams Farm, rate of rise, antecedent wetness and groundwater priming combine into a transparent point score. Its job is to increase situational awareness before a local physical threshold is necessarily reached.

Local action

Streamlet sensor

The local sensor uses fixed, physically meaningful thresholds. Its job is immediate local confirmation and action at the monitored reach.

Combined alerting

Use both

Email responds to a catchment escalation or a local action-threshold crossing. When both are elevated, Streamlet sends the highest-urgency message and says why. WhatsApp remains reserved for local TAKE ACTION.

Infographic showing Streamlet hybrid flood-alert logic, combining catchment scoring and local thresholds with WALTER-R as a future learning layer
Hybrid alert logic. Catchment information is intended to provide earlier awareness; local thresholds provide place-specific action triggers. Streamlet currently alerts from explicit rules rather than machine-learning predictions.
Catchment scoring details

Stage contributes 0–3 points; rate of rise contributes 0–3 with tighter thresholds at higher stages; 18 or more wet-flow days in 30 adds 1 point; groundwater at or above the 70th seasonal percentile adds 1 point and at or above the 85th adds 2. Totals map to NORMAL (0–1), WATCH (2–3), WARNING (4–6) and TAKE ACTION (7+), with community TAKE ACTION overrides for specified high-stage / rapid-rise combinations.

Meet WALTER-R

Walter came first. The name is a playful nod to the local Sir Walter Raleigh connection; the technical acronym was fitted afterwards: Wetness, Atmosphere, Land, Terrain and Event Rainfall — Runoff/Recharge Response.

The final R also nods to recharge-model thinking, including the 4R lineage. WALTER-R is not currently the operational warning engine. Streamlet’s live alerts remain rule-based and transparent. WALTER-R’s present job is quieter but important: collecting, organising and quality-checking the local historical dataset needed for a future machine-learning approach.

What WALTER-R is doing now

Streamlet is building the training archive before asking a model to make decisions. That means preserving the time series and event context that a future model would actually need.

  • Local stage, trend and threshold-crossing history from the Streamlet sensor
  • Catchment stage and rate-of-rise context from the EA gauge at Pophams Farm
  • Rainfall totals, wet-day counts and storm context
  • Groundwater seasonal-percentile / priming information
  • COSMOS-UK soil-moisture and atmospheric-drying context
  • Derived Streamlet status history and alert-event outcomes

What WALTER-R may do later

Once the local dataset is mature enough, WALTER-R can be tested as a supervised learning layer: essentially asking whether the historical combinations of rainfall, wetness, groundwater, drying and recent stage behaviour can anticipate rapid stream response better than static rules alone.

Possible future roles: event classification, response-likelihood scoring, earlier warning of rapid rise, or advisory confidence estimates. Any future WALTER-R output would need careful validation against real events before being trusted operationally.

Why not use machine learning already?

Because local machine learning is only as good as the data behind it. Streamlet is still in the observation-and-learning phase. The sensible first step is to collect a coherent archive of inputs, conditions and outcomes. In other words: no point teaching Walter from a half-empty notebook.

Why “Streamlet”?

Dear native brook! wild streamlet of the West!

That is Streamlet’s shorthand for what the project is trying to do. The name itself comes from Samuel Taylor Coleridge’s Sonnet to the River Otter, with its “streamlet of the West”. Streamlet began as a Raspberry Pi curiosity project and grew into a small digital catchment observatory: part hydrology, part electronics, part coding experiment.

Talk, comment, follow

Comments are welcome by email. There is no comment database, form submission or public comment storage on this website.

Feedback is sent by email; comments are not stored on this website.

Climate giving. Streamlet is a personal project, but climate resilience is bigger than one stream. Running the Raspberry Pi, hosting the website and developing the project all have a small environmental footprint. Streamlet therefore makes occasional donations to evidence-led climate action, including the Giving Green Fund. This is a voluntary contribution rather than a formal carbon offset, carbon-neutral claim or certification.
Important information. Streamlet is an independent personal project and experimental flood-awareness tool. It is not an official flood-warning service and is not operated, approved or endorsed by the Environment Agency, the Lead Local Flood Authority or Colaton Raleigh Parish Council. Data feeds can be delayed, unavailable or incorrect, and Streamlet’s interpretation of conditions is provided on a best-endeavours basis only. Always check official Environment Agency flood information. Do not rely on Streamlet instead of your own observations and judgement. Nothing on this website replaces your own eyes, instincts and common sense. If flooding presents an immediate risk to people or property, act on what you can see and follow official emergency advice.